North Atlantic inflow

Figure 1. Inflow of North Atlantic Water to the Barents Sea.
Inflow of North Atlantic Water (NAW) passes from the North Atlantic through the Faroe-Shetland Channel and into the Norwegian Sea. The current continues north with a minor inflow to the Barents Sea. One-part returns to the Greenland Sea, and one part has an inflow to the Arctic Ocean through the Fram Strait. From the Fram Strait, the current circulates in the Arctic Ocean and returns to the Greenland Sea return current (Figure 1). It has been well known for decades that this current has a major influence on the climate in northern Europe. To contribute to the study of regional climate variability, the temperature in the Faroe-Shetland Channel and the Kola section in the Barents Sea have been monitored for more than 100 years; this represents two of the longest oceanographic time-series in the world. The North Atlantic Water temperature and the Kola section water temperature represent long-term regional climate indicators. Better understanding of the causes of fluctuations of these indicators may lead to a better understanding of climate variability and forecast climate change.
North Atlantic Water controls the climate of the northern part of Europe. The water current passes the Faroe-Shetland Channel and into the Norwegian Sea and continues north with a minor inflow to the Barents Sea. In the Barents Sea Kola section, the water temperature has been monitored since 1900 and now represents an indicator of Arctic climate, expected Barents Sea biomass growth and expected economy growth along the Norwegian coastline.
The Barents Sea temperature

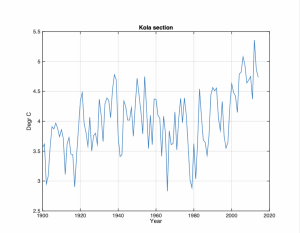
Figure 2. The Kola section data series from 1900 to 2014.
The Kola data series is measure in the Barents Sea in the period from 1900 to 2014 and represents the longest continue oceanographic data series in the world. The data used here were monthly temperature values from the upper 200m in the Kola section along the 331300 E medial from 701300 N to 721300 N in the Barents Sea. The Kola data series is monitored by PINRO in Murmansk, Russia and supported by PINRO, Murmansk (Vladimir Ozhigin, personal communication 2015). The Figure 2 shows that the data Barents Sea temperature increased from about 3.5 to 4.75 degrees in this period. At the same time the data series has large fluctuations that looks random. Is this a random or a natural variability? To answer this question, we may first transform the data series into a wavelet spectrum
The Barents Sea temperature has grown the last 30 years to a level, far above historical records. The purpose of this study is to investigate new trends in the Barents Sea temperature variability. Will the Barents Sea temperature continue to grow, or will the temperature turn into a new cold period? The results show that the temperature in the Barents Sea most likely has reached a turning point and we may expect a temperature reduction period for the next 30 years.
Barents Sea Temperature periods

Figure 3. Wavelet spectrum Wko(s, t) of the Kola data series, for s=1…0.6N and t=1900 to 2014.
The computed wavelet spectrum Wko(s,t) of the Kola data series is shown on Figure 3. The wavelet spectrum Wko(s,t) represents a time period from 1900 to 2013 and a wavelet scaling range is s=1…0.6N, and the data series contains N=(2014-1900)=114 data points. The identified wavelet spectrum Wko(s,t) has a maximum at: [(3.7, 1943), (4.7,2007)], a mean period 64 years. Wko(s,t) has minima at [(-3.1, 1911), (-4.1,1978)], or in a period of 67 years. If this is a stationary period, we may expect a new minimum at approximately the year 1978+60=2048.

Figure 3. Wavelet spectrum Wkom(s, t) of the deterministic model of the Kola data series, for s=1…0.6N and t=1900 to 2100.
The identified stationary wavelet periods may be transformed into a set of deterministic periods by the simple model. Figure 3 shows the wavelet spectrum from the deterministic model in the period 1900 to 2100. The wavelet spectrum shows that we may expect a maximum at in 2017 and a new minimum at approximately in 2050, and a mean level like the period from 1900 to 1920. The Barents Sea temperature has grown the last 30 years to a level, far above historical records. The purpose of this study is to investigate new trends in the Barents Sea temperature variability. Will the Barents Sea temperature continue to grow, or will the temperature turn into a new cold period. The results show that the temperature in the Barents Sea most likely has reached a turning point and we may expect a temperature reduction period for the next 30 years. A possible 30-year long temperature reduction in the Barents Sea will introduce a colder climate in North-Europe and influence the marine ecosystem in the Norwegian Sea and the Barents Sea. This will have a dramatic effect on the marine industry, the maritime industry, the fish farm industry and the economy on the Norwegian coastline.
References
- Yndestad H: (2016). The Barents Sea Temperature Variability 1900-2100. A new study
- PINRO, Murmansk, (2016): http://www.pinro.ru/labs/hid/kolsec1_e.htm
- PINRO, Murmansk, 2016: http://www.pinro.ru/labs/hid/kolsec1_e.htm
- Yndestad, H. (1999). Earth nutation influence on the temperature regime of the Barents Sea. ICES Journal of Marine Science, 56(jmsc.1999.0469,), 381–387. http://doi.org/jmsc.1999.0469
- Yndestad, H. (2003). The code of the long-term biomass cycles in the Barents Sea. ICES Journal of Marine Science, 60(6), 1251–1264. http://doi.org/10.1016/S1054-3139(03)00152-8
- Yndestad, H. (2004a). The cause of Barents Sea biomass dynamics. Journal of Marine Systems, 44(1-2), 107–124. Retrieved from www.elsevier.com/locate/jmarsys
- Yndestad, H. (2009). The influence of long tides on ecosystem dynamics in the Barents Sea. Deep-Sea Research Part II: Topical Studies in Oceanography, 56(21-22), 2108–2116. http://doi.org/10.1016/j.dsr2.2008.11.022
- Yndestad, H., & Stene, A. (2002). System dynamics of the Barents Sea capelin. ICES Journal of Marine Science: Journal Du Conseil, 59: 000–00(2002), 1155– 1166. http://doi.org/10.1006/jmsc.2002.1285
- Yndestad, H., Turrell, W. R., & Ozhigin, V. (2008). Lunar nodal tide effects on variability of sea level, temperature, and salinity in the Faroe-Shetland Channel and the Barents Sea. Deep-Sea Research Part I: Oceanographic Research Papers, 55(10), 1201–1217. http://doi.org/10.1016/j.dsr.2008.06.003

Good day! I could have sworn I’ve visited this website before but after going through many of the articles I realized it’s new to me. Anyways, I’m certainly pleased I found it and I’ll be book-marking it and checking back often!