Records from seal hunters, fishermen and Arctic explorers have contributed to Barents Sea ice edge position data series that covers a period of 440 years. A new analysis of the data series reveals an Arctic climate variability, controlled by lunar-driven periods of 18.6, 74.4 and 223 years. The lunar-driven ice edge position periods may explain the Arctic climate variations, from a cold Arctic climate period close to 1850, to a modern warm Artic climate period up to 2000. The lunar-driven periods have a computed upcoming maximum ice extent and a deep cold Arctic period from 2066 to 2073 A.D. The computed time from the modern maximum warm Arctic climate to next deep cold Arctic climate is only 50 years.

Introduction
Figure 1 shows the inflow of North Atlantic Weather to the Barents Sea and the Arctic Ocean and the movement of the Barents Sea Edge position. Warm North Atlantic Water has an inflow to the Norwegian Sea. Some part is flowing into the Barents Sea and some part are flowing into the Arctic Ocean. The flow is returning at the Greenland Sea.
The ancient Greek word for bear, ‘‘Arctos’’, lends its name to the constellation of the Great Bear. The Arctic takes its name from this constellation, so linking the region with the constellation that makes the sky near the North Pole. Inflow of lunar-driven temperature variability in North Atlantic Water and small fluctuations in the northern pole may explain the Arctic climate oscillation.
The Arctic Circle
The Arctic is the area north of the Arctic Circle (66(32#N), which includes the area of the midnight sun. The cold Arctic Ocean acts as an energy sink. The sun is never high in the sky, and most of its energy is reflected back to space by snow and ice in summer. Cooled water ac- cumulates in circulating layers. The Arctic Ocean has four layers: Arctic Surface Water; Atlantic Water; Deep Water; and Bottom Water; all have different densities and circulation patterns. Atlantic Water from the Norwegian Sea enters the Eurasian Basin through the Fram Strait and underneath the surface layer. At a level of about 200-900 m, it follows the continental slope east and north until it meets the Transpolar Drift, then returns to the Greenland Sea. The Atlantic Water residence time is about 25 years (Aagaard and Greisman, 1975; Wallace and Moore, 1985). The circulating pattern in the Arctic Ocean is most likely influenced by the circulating polar movement. Deep Water down to 2600 m from the Norwegian Sea is exchanged between the Greenland Sea and the Eurasian Basin (Nansen and Amundsen Basins).
Arctic temperature variability
The British astronomer Edmond Halley (1656-1742) was probably the first to publish a paper on climate influence on biomasses in the North Sea. Halley tried to solve the problem of the determination of longitude and conducted pioneering investigations in geophysics, trade winds, tides, the magnetism of the earth and the relationship between the weather and dynamic air pressure. He estimated the longitude by observing the 18.03-year lunar saros cycle, the cycle that is associated with the time between eclipses. Using this approach, he published a method that he claimed to be accurate within 69 miles at the equator. In 1699 he sailed in the Atlantic and made magnetic maps. In the paper Atlas matitimus et commercialis of 1728 he described the theory of a fluctuating herring stock between the Arctic Ocean and the North Sea, controlled by climate conditions (Wegner, 1993).
The Zöppritz Wind-theory
The German mathematician Karl Zöppritz (1838-1885) developed a model that showed over time the wind can affect water at great depths. Helland-Hansen and Nansen (1909) found a relationship between the air temperature at the Ona light and fluctuations of Northeast Arctic cod. Helland-Hansen and Nansen concluded that there is a climatic influence on biomass fluctuations. After Nansen, the wind-theory has been widely accepted. This theory has characterized the view of the changes in Arctic climate right up to our time and support the foundation the understanding global warming and Arctic ice position variability, as a process, driven by greenhouse gasses.
North Atlantic Oscillation
The NAO index represents a wind direction indicator. The North Atlantic Oscillation (NAO) is a weather phenomenon in the North Atlantic Ocean of fluctuations in the difference of atmospheric pressure at sea level between the Icelandic low and the Azores high. Through fluctuations in the strength of the Icelandic low and the Azores high, it controls the strength and direction of westerly winds and location of storm tracks across the North Atlantic. Positive values of the NAO index are associated with low atmospheric pressure difference between Iceland and Azores. In Scandinavia it causes warm winds from west, mild winters and rain-full summers. Negative values of the NAO index are associated with high atmospheric pressure difference between Iceland and Azores. In Scandinavia it causes cold winds from north, cold winters and less rain-full summers. The NAO winter index variability has a period coincidence to lunar periods in North Atlantic Water variability and Arctic ice extent (Yndestad et al. 2008; Yndestad 2006). Dickson et. al, 2000 confirmed a correlation between the NAO winter index and Arctic Ocean water inflow temperature (50-500m) and a correlation between NAO winter index and Fram Strait Ice flux (km2/yr.). The study concludes “direct regional wind forcing over broadscale changes in the Arctic Ocean circulation in determining the year-to- year variability of ice flux”. Yndestad (2006) and Yndestad et. al (2006) studied the wavelet specter of North Atlantic Water temperature, the Barents Sea (Kola) data series, Arctic air temperature, Barents Sea ice extent, Greenland Sea ice extent and the NAO winter index. The result show that Barents Sea ice extent is controlled by lunar period in North Atlantic Water and the NAO index is controlled by the mean Greenland and Barents Sea ice extent. Smedsrud, L. H., et al. (2013) studied the wind-feedback hypothesis between air heat transport and Atlantic heat transport and the ocean-feedback hypothesis. The study concluded: “The Barents Sea marine climate is set by the ocean and the presence of warm Atlantic Water, but the atmosphere governs variability on time scales shorter than a year. If the sea ice disappears, the atmosphere may be more dominant in the future.”
The Ljungman Solar-theory
The solar theory goes back to Ljungman (1879, 1882). The Swede Axel Ljungman studied records from Bohuslan herring fisheries from 1000 A.D. and found herring periods of 30 to 60 years. Ljungman presented the theory that long-term biomass fluctuation of herring was related to a 111-year sunspot cycle (Ljungman, 1879). In 1960´s R. G Currie started to analyze a number data series by Maximum Entropy spectrum analysis. He identified the 11-year solar cycle in the Earth rotation, the temperature in North America and world weather records (Currie et al. 1987). Later the 11-year solar period has been identified in a number of other investigations of global climate indicators. The solar-Arctic ice theory is based on the idea that there is a positive feedback between radiation from the Sun and melting of Arctic ice. Melting of Arctic ice leads to less reflection of sunlight from Arctic ice and more warming of Arctic seawater. Arctic ice extent variability then will be amplified.
The Pettersson Lunar-theory
In 1909, the Swedish oceanographer Dr. Otto Pettersson (1848-1941) studied the relationship between herring catches and tides in Gullmarfjord on the west coast of Sweden. The study showed that the variation in the lunar perigee was related to freshwater movements and the arrival of schools of herring. As the ocean water presses in toward that inland sea, it dips down, allowing fresh surface water to roll out above it. At that depth, where salt and fresh water come into contact, a sharp layer of discontinuity forms, much like the surface film between water and air. This salt layer has a vertical fluctuation in long time series. Pettersson found that the fluctuation correlated with the moon’s phases, long-period tides and long-period herring catches. Pettersson argued that there were two types of tides; the diurnal and the semi-diurnal tide caused by the rotation of the earth under the gravitational field of the sun and the moon, and the parallactic tide. This tide depends upon the varying distance of the sun and the moon and their position with respect to the earth. By analyzing these distances, he found oscillating periods of 9, 18, 93, 111, 222 and up to 1433 and 1850 years. The most important cycle was the 18.09-year saros cycle and the 111-year cycle that he called “The Greater Saros” (Pettersson; 1914b, 1915, 1930; Hans Pettersson, 1915). In 1887, the German geography professor Otto Krümmel (1854-1912) published the first major handbook on modern oceanography. Here, Krümmel had a critical commentary on the importance of long tidal waves, discovered by Georg H Darwin (son of Charles). At a time when modern science was being created, the Moon was not a politically correct explanation, and wind-theory from Zöppritz and the comment from Otto Krümmel were widely accepted up to our time.
Russian scientists. Izhevskii (1961, 1964) and other Russian scientists developed a system view of the Atlantic Ocean, Arctic and the Barents Sea. Maksimov and Smirnov (1965, 1967) identified a standing 18.6-year lunar nodal tide as a standing wave in Atlantic Oceans. Malkov (1991, 2002) identified a statistical relationship between earth pole movements and biomass fluctuations in the Barents Sea. Ottestad (1942) investigated landings in Lofoten from 1875 to 1940. Cycles were identified by a visual inspection of similarities in fluctuations. He found maximum cycles of Northeast Arctic cod at intervals of 11, 17.5, 23 and 57 years. The cycles were compared to fluctuations in tree rings from Troms and the conclusion was that biomass fluctuations must be influenced by climate fluctuations. Later he compared sunspot cycles and biomass cycles (Ottestad, 1979). Wyatt et al. (1994) investigated the time series of cod landings records from Lofoten and found a cycle of 18.6 years. The cycle was explained by the influence from the 18.6-year lunar tide. Yndestad introduced new wavelet spectrum analysis methods and identified a lunar spectrum [18.6/3, 18.6, 3*18.5, 4*18.6] (yr.) in data series of sea-level from Aberdeen, Oslo-fjord to Murmansk, temperature and salinity in inflow of North-Atlantic water to the Norwegian Sea and the Barents Sea, sea temperatures and rainfall in Norway, Arctic Ice extent in the Barents Sea, Earth axis movements and the marine eco-system in the Barents Sea (Yndestad 1999a, 1999b, 2004, 2006, 2009), (Yndestad et al. 2008). The lunar nodal spectrum is explained by a chain of events between the Atlantic Ocean and the Arctic Ocean. Egbert and Ray (2000) show that about 1 TW, or 25–30% of the total dissipation, occurs in the deep ocean. The estimated mixing energy required to maintain the large-scale thermohaline circulation is about 2TW. One-half could therefore be provided by the tides.
Arctic Ice Edge Position 1800-2020
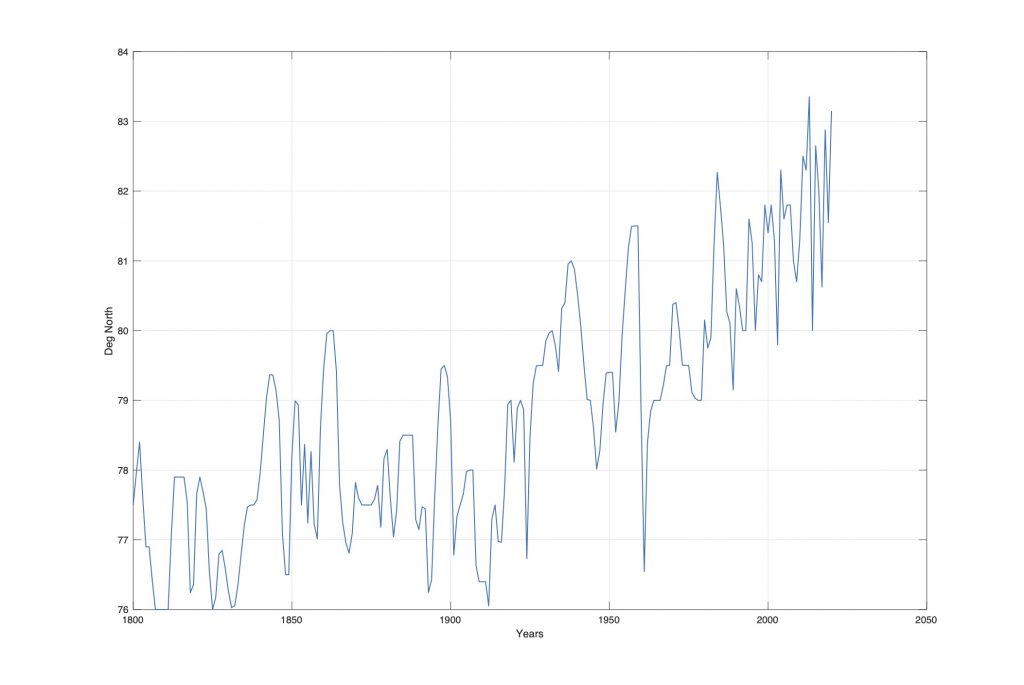
Figure 2. The Barents Sea Ice edge position April, 1800-2020 (Vinje 1999; (Falk-Petersen et al. 2015) (personal communication).
Figure 1 show the Barents Sea ice edge position data series from 1800 to 2018 (Vinje 1999; Falk-Petersen et al 2015). In this time period the data series has a maximum position and minimum ice extent at 82 (Deg), minimum position and maximum ice extent at 76 (deg). The position increases from 1920 to 2007. The data series covers 153 recorded data points and 66 cubic spline interpolated data points. In this time period we can estimate stationary periods up to 218/2 = 109 yr.
Arctic Ice Position Variability 1800-2020
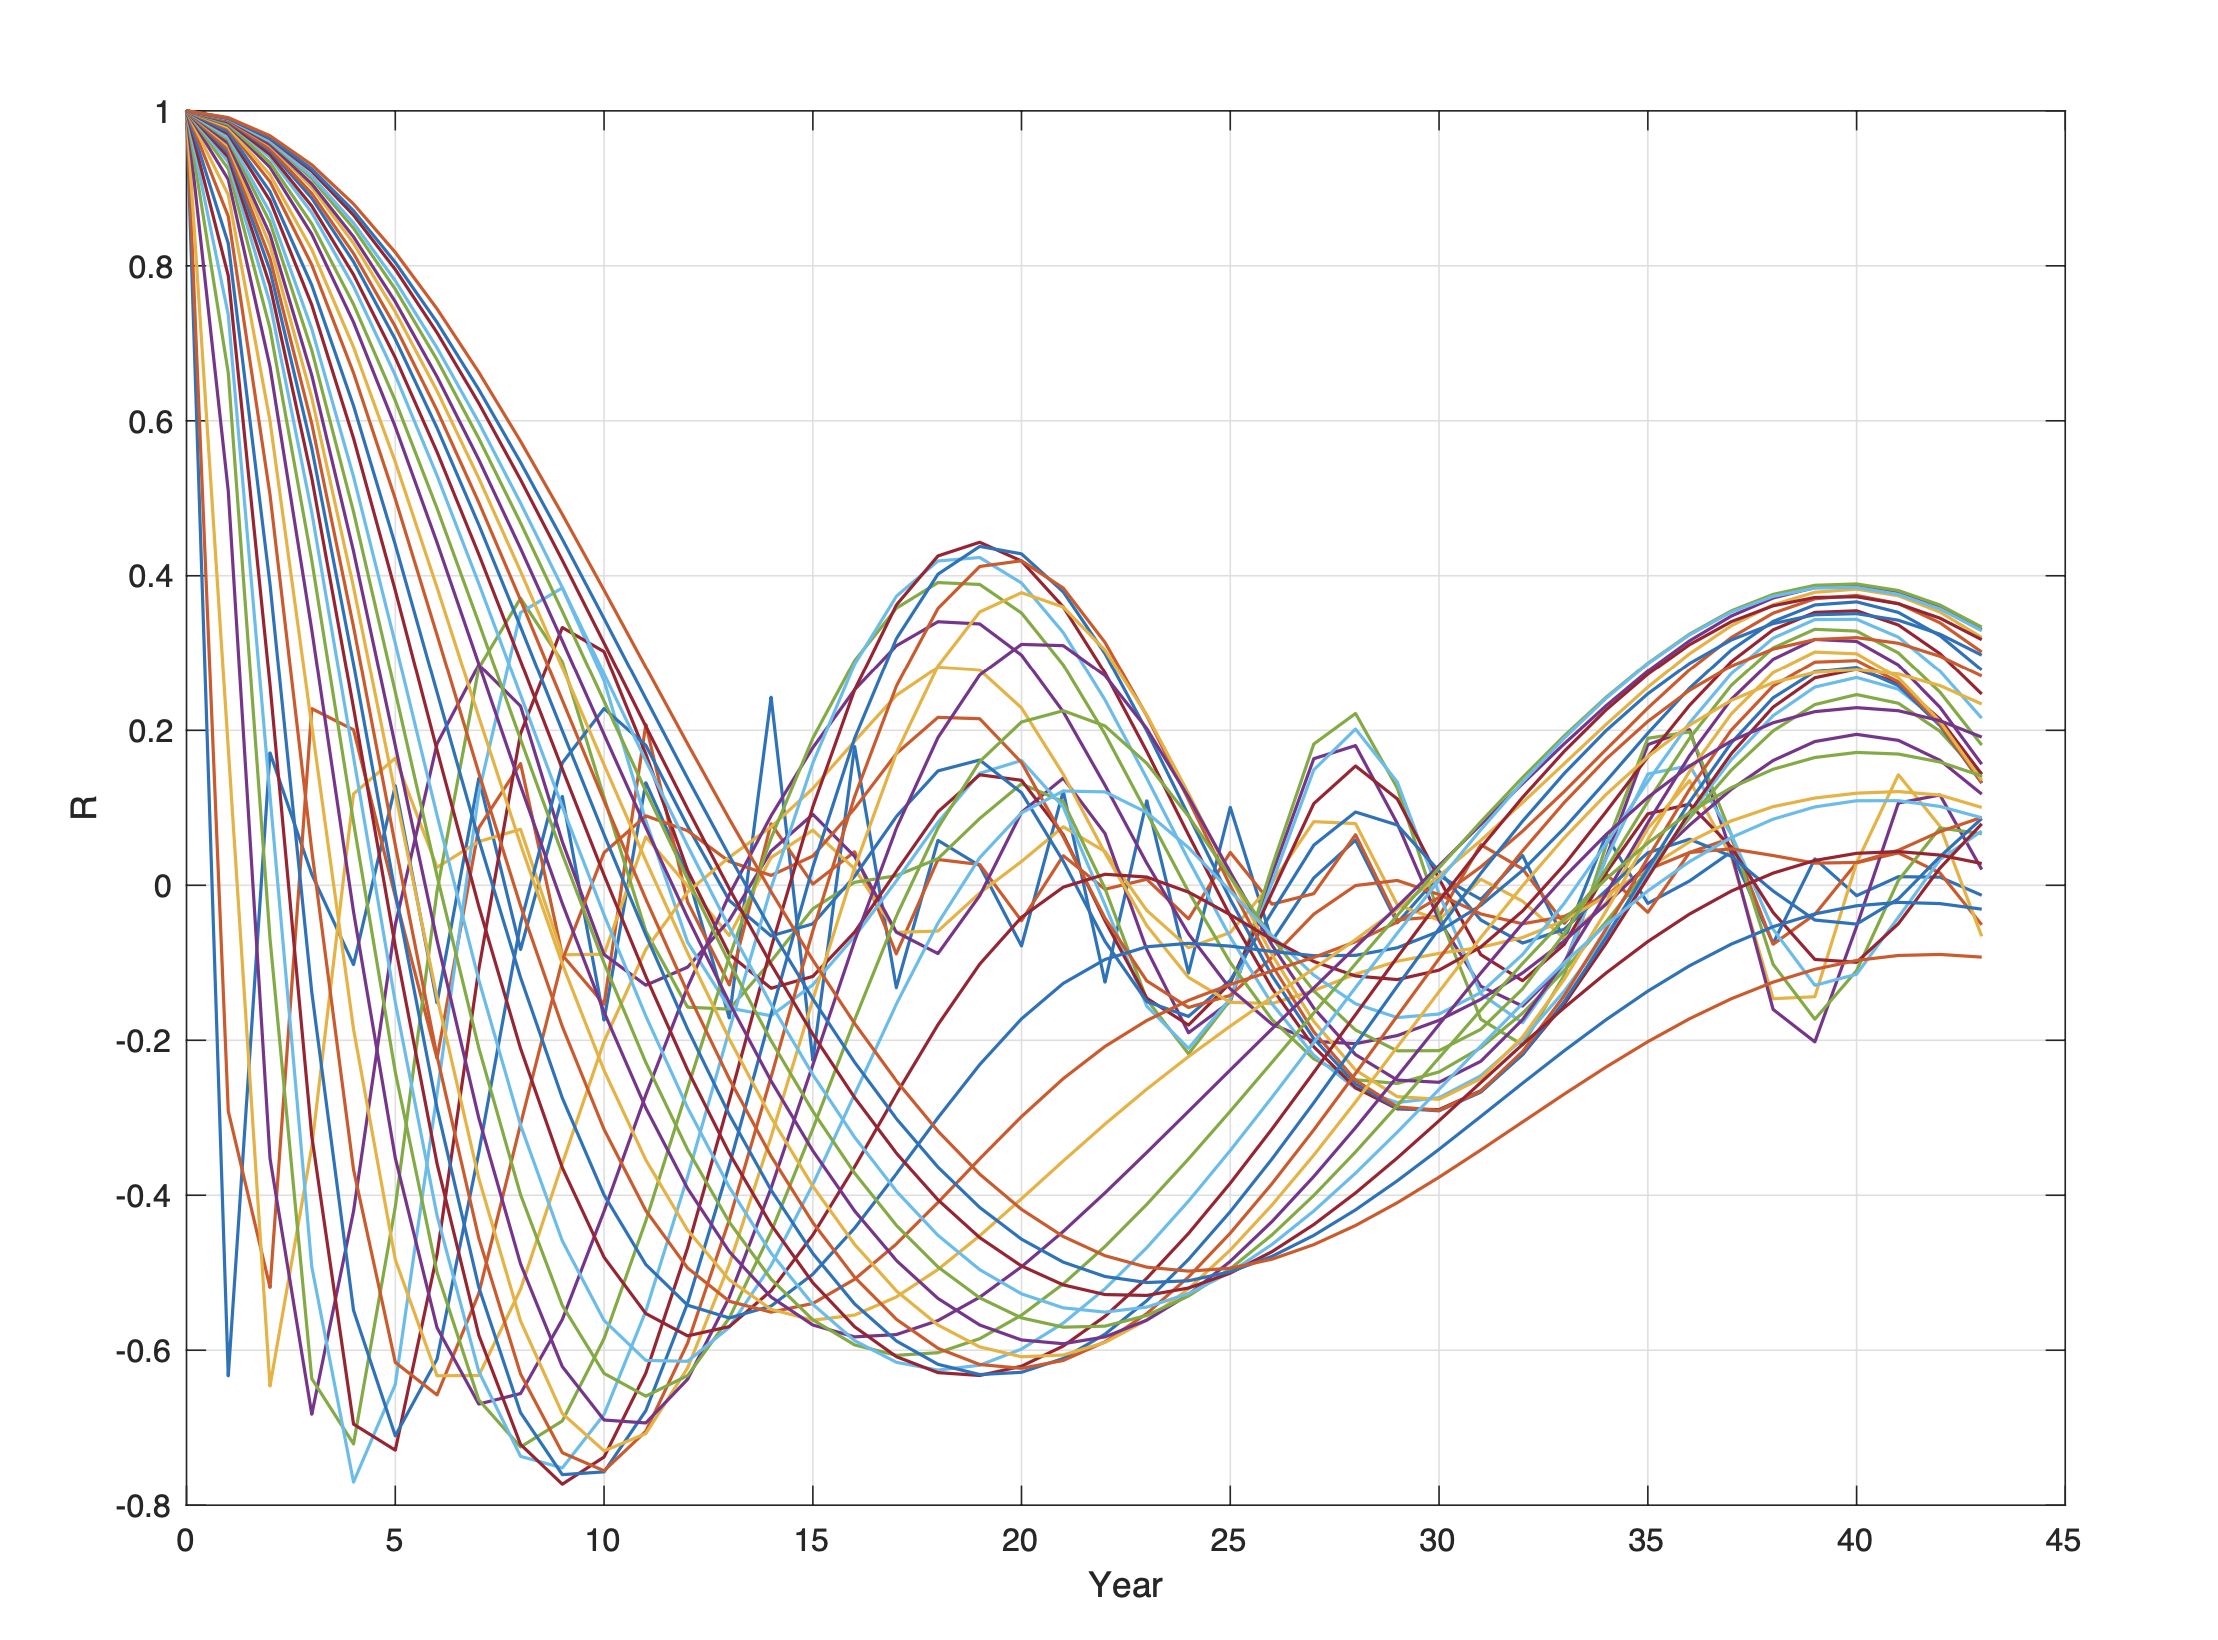
Figure 3. The Barents Sea ice edge position wavelet autocorrelation spectrum WAie(R(s), t) for s = 1…130 and t = 1800…2020.
The computed wavelet spectrum of the Barents Sea edge position (Figure 3) shows dominant periods in the data series (Figure 4). The computed autocorrelations of the wavelet spectrum (Figure 4) show correlation to stationary periods (Figure 3). The computed autocorrelations in the wavelet specter has the correlations to the dominant periods: WAie(R, T) = [(0.40, 9), (0.44, 19), (0.30, 40), (0.35, 57), (0.52, 74)], which show a correlation vector R = [0.40, 0.44, 0.30, 0.35, 0.52] to the stationary periods Tie = [9, 19, 40, 57, 73] (yr.). The coincidence difference to the 18.6-year lunar nodal period spectrum Tln = [18.6/2, 18.6, 2*18.6, 3*18.6, 4*18.6] is [Tie – Tln] = [0, 0, 3, 1, 1] (yr.), which has a mean difference of only 1 year.
The autocorrelation wavelet specter represents a data series “fingerprint”. The close coincidence to the lunar spectrum represents an evidence of a lunar-driven control of Barents Sea ice edge position variability.
The dominant 74-year period
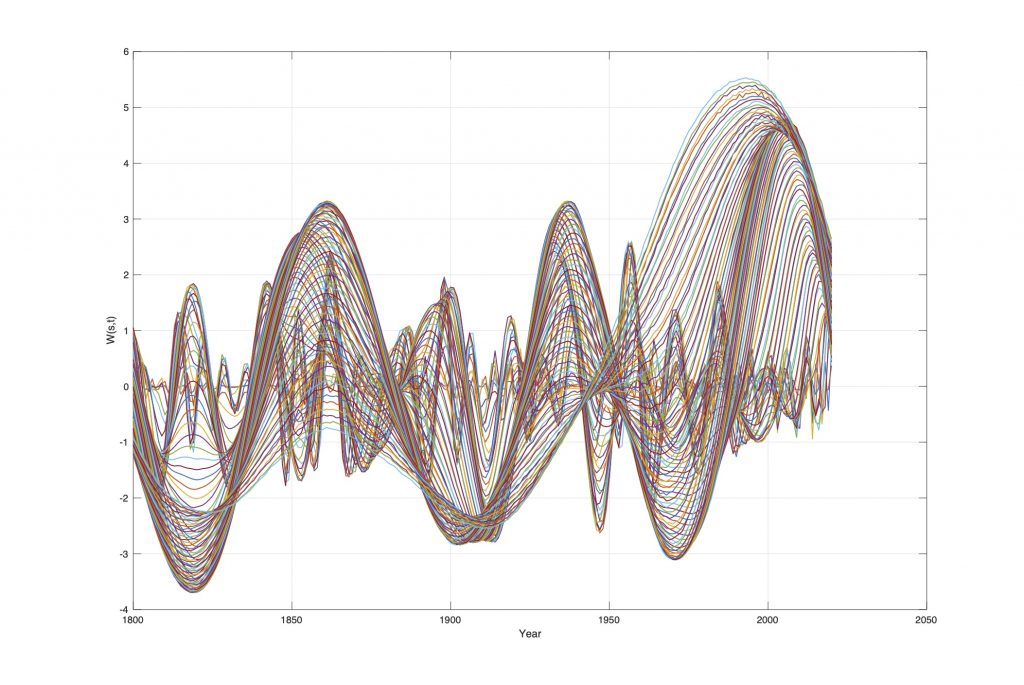
Figure 4. The Barents Sea ice edge position wavelet spectrum Wie(s, t) for s = 1…130 and t = 1800…2020.
The Barents Sea Ice edge position data series (Figure 2) is transformed into a wavelet spectrum Wei(s, t) for s = 1…130 and t = 1800…2018 (Figure 4). The dominant period in the wavelet spectrum has amplitude and phase-shifts at: Wie(s(max/0), Fie) = [(+0,1800), (-3.4, 1818), (-0, 1838), (3.2, 1859), (+0, 1882), (-2.8, 1906), (-0, 1925), (2.9, 1943), (+0, 1962), (-2.5, 1970), (-0, 1992), (4.3, 2010)]. The wavelet spectrum phase-shifts have mean distances of 18.8 years, close to the 18.6-year lunar period. The total period is 4*18.8 = 75.2 years. The coincidence difference between the identified period and the deterministic lunar nodal period is: [Tie(75.2) – Tln(4*18.6)] = 0.7 years. The wavelet spectrum confirms that Arctic ice position variability from 1800 AD, has a stationary lunar period of 4*18.6 = 74.4 years.
Upcoming climate events
The stationary period has the computed upcoming phase-shifts of: Wie(s(max/0), Fie) = [(+0, 2029), (min, 2047), (-0, 2066), (max, 2085)]. More ice extent to a minimum position and colder period from 2029 to a deep minimum close to 2047 A.D. From 2047 the position increases to a maximum close to the year 2085.

Figure 5. The Barents Sea Ice edge position Wavelet Power Spectrum for t = 1800…2020 and s = 1…130.
The Barents Sea ice edge position wavelet spectrum Wie(s, t) is transformed into a wavelet power spectrum WPie(s, t) =Wie(s, t)*Wie(s, t) as shown on Figure 5. The wavelet power spectrum from 1800 to 2020 has a maximum and phase-shifts at the years: WPie(s(max/0), Fie) = [(16.5, 1819), (-0, 1840), (14.8, 1861), (+0, 1888), (15.8, 1903), (-0, 1924), (13.2, 1937), (+0, 1964), (5.9, 1981), (-0, 1994), (19.7, 2010)]. A maximum ice edge position extent and a maximum cold climate the years [1819, 1903, 1981]. A minimum ice edge position extent and a maximum warm period the years [1861, 1937, 2010]. The wavelet power spectrum maximum has a mean time distance of 37 years and confirm mean total period of 2*37=74 years.
Comment
The wavelet power spectrum has the same period amplitude, which confirm a stationary 74.4-year climate period. At the same time Figure 5 show a longer period that has a maximum (cold climate) close to 1850 and a maximum (warm climate) close to 1975. This period explains why there was the long ice position trend from a warmer climate, from 1850 to 2020 (Figure 2). The Barents Sea ice edge position variability has longer periods.
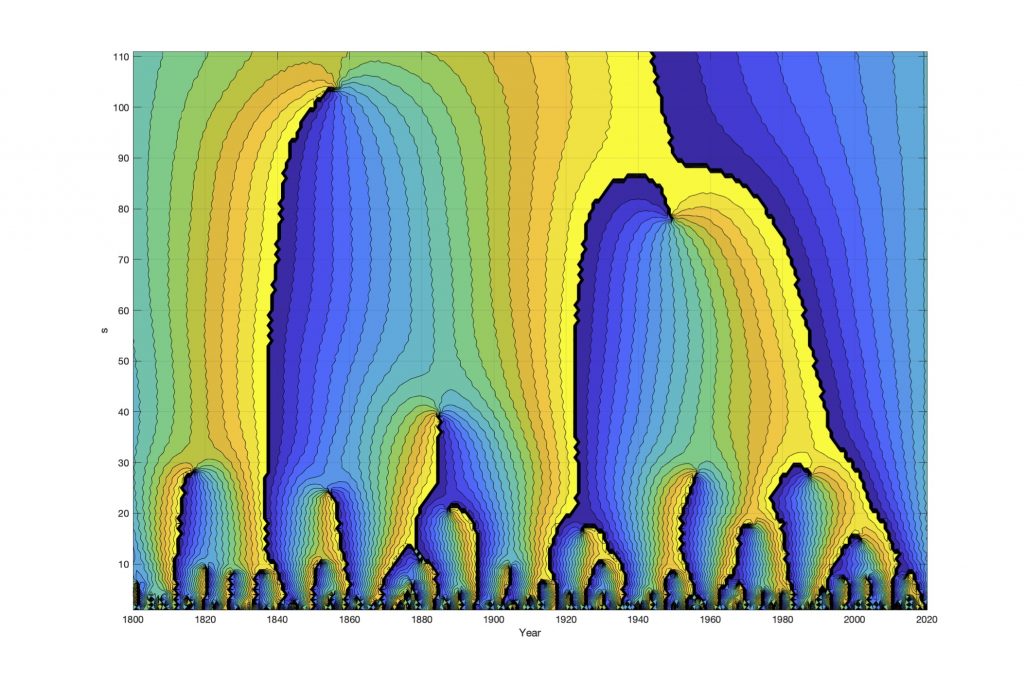
Figure 6. The Barents Sea Ice edge position Wavelet Phase Spectrum for t = 1800…2020 and s = 1…130.
Figure 6 shows the wavelet phase spectrum of Arctic ice edge position variability. The Y-axis represents the wavelet spectrum and colors represents the period phase angle [0…2pi] (rad). The figure shows a line when a period have a phase shift 2pi to 0 (rad). The wavelet phase spectrum confirms a period (and climate) phase shift at the years [1840 1924, 1994] and a possible long period that has a phase shift at the year 1924.
Arctic Ice Position from 1579-2020
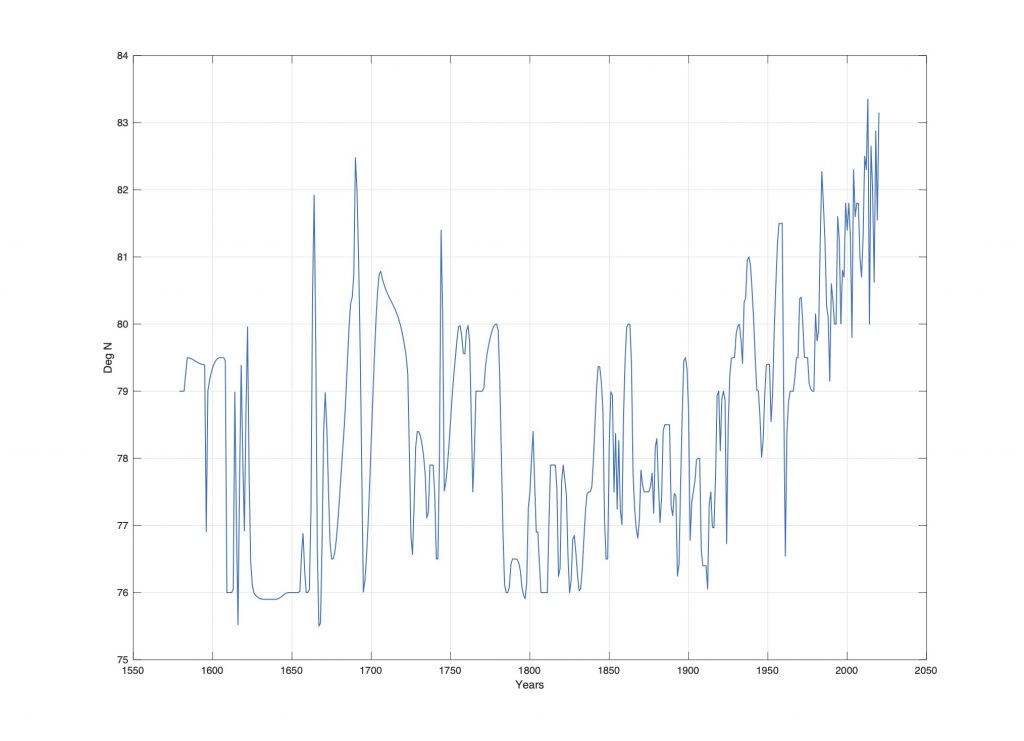
Figure 7. The Barents Sea Ice edge position 1579-2020.
Figure 7 show the Barents Sea ice edge position data series from 1579-2018, which cower a period of 439 years (Vinje 1999) (Falk-Petersen et al. 2015) (personal communication)). The data series show a maximum period close to 1725 and 2000. From 1579 to 1800 the data series has 83 recorded data points and 139 data points interpolated by cubic spline interpolations, shown as continues lines on Figure 7. The total data series cover a period of 439 years which may represent reliable periods up to 220 years. In this long data series, missing data is expected to be estimated in the power spectrum.
The wavelet power spectrum 1579-2020
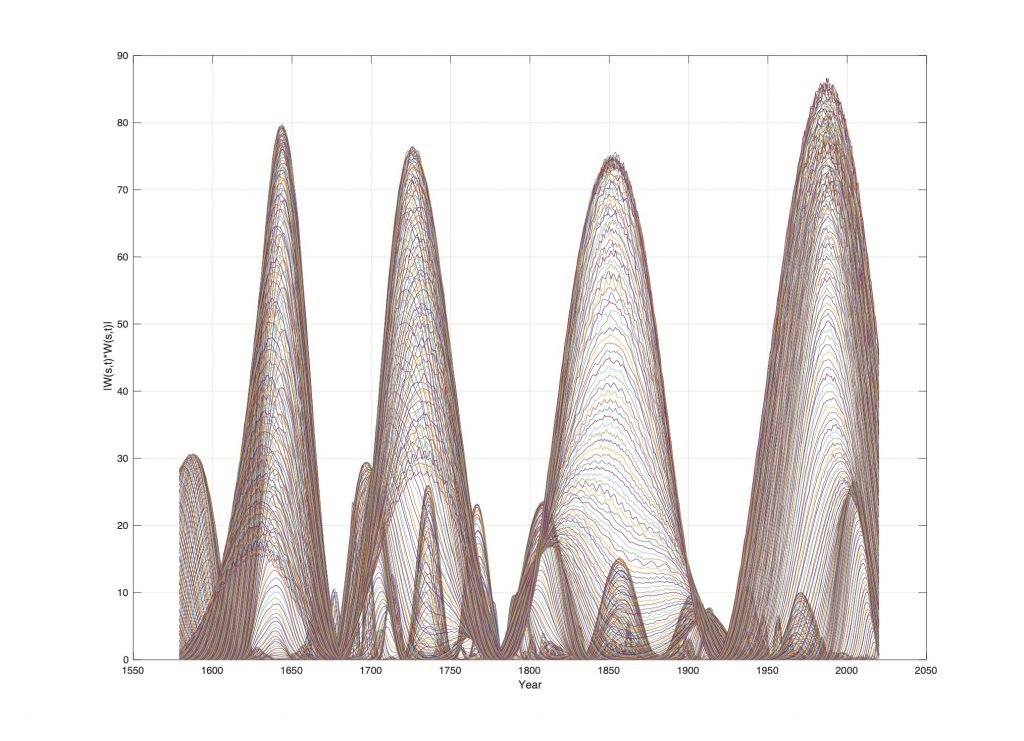
Figure 8. Wavelet power spectrum WPie(s, t) of the Barents Sea ice extent wavelet spectrum for t = 1579…2020 and s = 1…250.
Figure 8 shows the wavelet power spectrum of the Barents Sea ice position for t = 1579…2018 and s = 1…250. The dominant periods in the wavelet power spectrum has a maximum and phase-shifts at: WPie(s(max), Fie) = [(+0, 1580), (-61.0, 1644), (-0, 1680), (+80.5, 1726), (+0, 1781), (-81.0, 1849), (-0, 1910), (+66.0, 1987)]. A maximum ice extent and a maximum cold period the years [1644, 1910], a minimum ice extent and a maximum warm period the years [1726, 1987]. The mean periods phase-shift distance is 58 years. The total period is 4*58 = 232 years. The estimated coincidence to the lunar period is: (232 – 3*4*18.6) = 8.6 years, which is close to the 4*74.4 = 223.2 year lunar period. The wavelet power spectrum on Figure 8 confirm the close relation between the identified 74-year and 223-year lunar-driven periods in Arctic ice position variability. Wavelet power periods of 223/2 = 111.6 year are related to harmonic periods of 3*74.4/2 = 111.6 years.
Upcoming events
The stationary 223-year lunar-driven power period has the computed upcoming phase-shifts: WPie(s(223), Fie) = [(+0, 1920 + 223/4 = 2018), (min, 1850 + 223 = 2073), (-0, 1920 + 223 = 2143), (max, 1973 + 223 = 2196)]. The period has computed phase-shift close to the year 2018, a deep minimum position, maximum ice extent and maximum cold climate close to the year 2073 A.D.
The stationary 74-year lunar-driven period has the computed upcoming phase-shifts of: Wie(s(max/0), Fie) = [(+0, 2029), (min, 2047), (-0, 2066), (max, 2085)]. The 74-year period and the 223-year period is negative at the same time in the period 2029 to 2066 A.D. We may then expect a computed minimum ice position and a deep minimum cold period in the period 2066 to 2073 A.D.
The wavelet phase specter 1579-2020
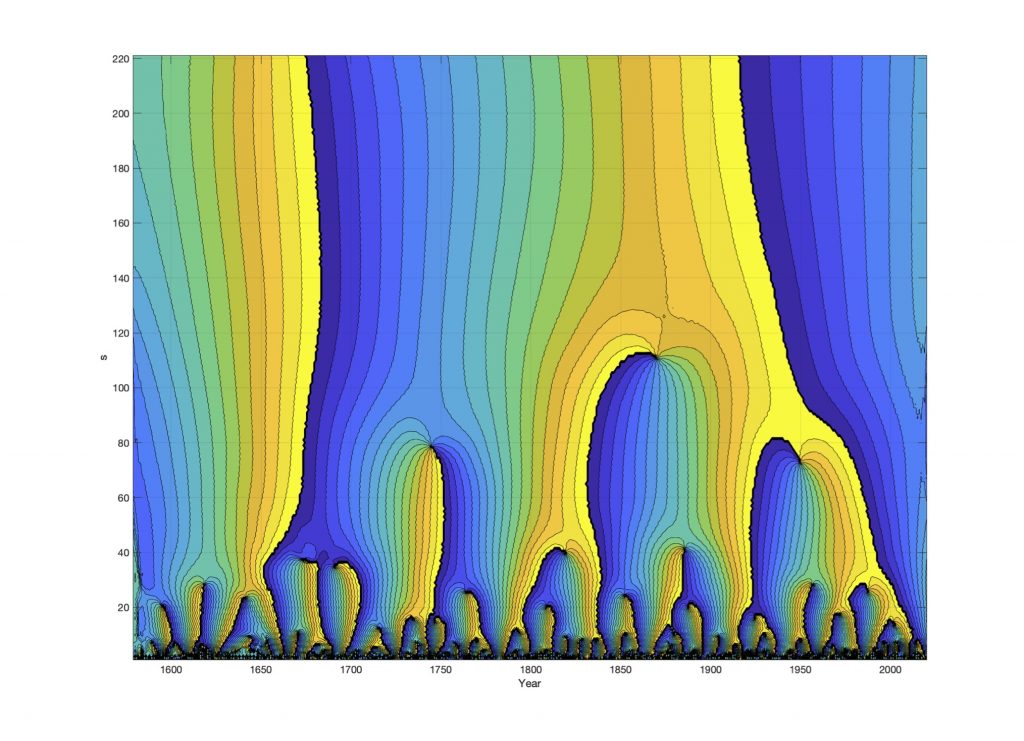
Figure 9. Wavelet phase spectrum WFie(s, t) of the Barents Sea ice position wavelet spectrum for t = 1579…2020 and s = 1…250.
Figure 9 shows the wavelet phase spectrum of Arctic ice edge position variability from 1579 to 2020. The Y-axis represents the wavelet spectrum and colors represents the period phase angle [0…2pi] (rad). The figure shows a line when a period have a phase shift 2pi to 0 (rad). Figure 6 confirm a 223-year period phase shifts to less ice extent and warmer climate at the years [1689, 1910], and the 74.4-yr period climate phase shifts at the years [1840 1924, 1994].
Discussion
The data series
The Barents Sea ice edge position data series cover a time period of 439 years from 1579 to 2018. In this time period we may estimate periods up to 220 years. From 1800 to 2018 the data series have 153 recorded samples and 66 spline interpolated samples. From 1579 to 1800 the data series have 83 recorded samples and 138 spline interpolated samples. This limited number of recorded samples introduces a serious noise spectrum that may ruin the period estimates. To reduce noise, the lunar spectrum is estimated from 1800 to 2020. From 1579 to 2020 the data series is cubic spline interpolated and analyzed be computing the wavelet power spectrum. The spline interpolation has the ability to preserve the period spectrum in the data variability.
Main results
The investigation confirms a lunar-driven Barents Sea ice edge position variability. The variability has a coincidence to the deterministic lunar period spectrum of [18.6/2, 18.6, 2*18.6 = 37.2, 4*18.4 = 74.4, 3*4*18.6 = 223] (yr.). The mean difference between the stationary lunar period spectrum and the identified period spectrum is only 1 year. The period phase-coincidence between Barents Sea variability and ice edge position variability has a mean difference of only 2 years (Ref. Note). This close relation confirm that the Barents Sea ice position variability has a major influence from the Barents Sea ocean temperature variability, which is controlled by a lunar a lunar-driven temperature variability in inflow of North Atlantic Water (Yndestad et al. 2008).
Other investigations
The results are confirmed by other investigations. Yndestad (2006) studied the area of the Barents Sea ice extent which covers the Norwegian Sea, the Barents Sea, and the Kara Sea bounded by 10(E, 80(N, and 70(E, respectively. The data are based on April values from 1864 to 1998 (Vinje 2001). The investigation identified lunar periods of [18.6/2, 18.6, 4*18.6] (yr.). The same periods are found in Arctic Ocean, where lunar periods the periods [18.6/15, 18.6/3, 18.6, 4*18.6] (yr.) in Polar position variability (Earth nutation). This realtion indicate a possible resonance between North Atlantic Water inflow and Polar position variability. The new information from this data series analysis is the identification of the 223-year lunar period.
Explanation
The oscillation gravity between the Earth, Sun and the Moon causes an 18.6-year wobbling of the Earth axis and a standing 18.6-year lunar nodal tide between Equator and the Pole (Maximov and Smirnov, 1964, 1966, 1967), (Royer, 1993), (Currie, 1984), (Keeling and Worf, 1997), (Hansen el. Al 2015). The lunar nodal tide has a vertical amplitude direction and a horizontal current direction that causes a circular mixing of temperature profiles in the Atlantic Ocean. The stationary 18.6-year circular mixing of non-linear temperature profiles in ocean currents, causes a modulation of a lunar period spectrum in the Atlantic Ocean surface temperature variability. The modulated lunar controlled temperatures spectrum in the Atlantic Ocean follows North Atlantic Water inflow to the Norwegian Sea and three years later as inflow to the Barents Sea (Maximov and Smirnov, 1964, 1965, 1967), (Yndestad, 1999, 2006) (Yndestad et. al 2008) and the Atlantic Ocean. Warm North Atlantic Water inflow to the Barents moves the ice edge position to a higher degree position. Cold North Atlantic Water inflow moves the ice edge to a minimum degree position. Arctic Ocean upper Deep Water residence time in the Eurasian Basin is estimated to be about 75 years (Bonisch and Schlosser, 1995). This 75-year residence time is the same cycle period identified in polar motion, and extent of ice in the Barents Sea and Greenland (Yndestad 2006). In the Amundsen Basin, Bottom Water (depth >2600m) residence time is estimated to be 290 ?+/- 30 years (Bonisch and Schlosser, 1995). A 290 +/- 30 year residence time is close to the identified 223-year lunar period. The Botton Water is a fourth sub-harmonic period of the 75-year the upper Deep Water period. A possible explanation is resonance in Arctic Ocean forced by the 18.6-year Earth axis nutation (Yndestad 2006).
Implications
The implication of a lunar-driven Barents Sea ice position variability is a long-term deterministic long-term variability controlled by the Moon, as the first cause. The direct relation between Arctic climate and Barents Sea ice position variability reveals a deterministic lunar-driven Arctic climate variability, which are not controllable. Stationary lunar-driven periods have minima and maxima, controlled by the period phase-relations. The phase-relation between the stationary 74-year period and the 223-year period, explains the deep cold Arctic period close the year 1850 and a warming period, to a modern maximum warm Arctic period close to 2018. The deterministic lunar-driven periods have an upcoming computed minimum ice position and a deep cold Arctic period from 2066 to 2073 A.D. The time from maximum ice position and maximum warm Arctic climate, to a next minimum position and deep cold Arctic climate is only 50 years.
Reference
Literature
Currie, R. G., 1981, Evidence for 18.6 year (sic) signal in temperature and drought conditions in North America since A. D. 1800: Journal of Geophysical Research. 86:11,055-11,064.
Currie, R. G., 1984, Evidence for 18.6 year (sic) lunar nodal (sic) drought in western North America during the past millennium: Journal of Geophysical Research. 89:1295-1308.
Currie, R. G., 1987, Examples and implications of 18.6- and 11-yr terms in world weather records, Chap. 22, p. 378-403 in Rampino, M. R.; Sanders, J. E.; Newman, W. S.; and Konigsson, L.-K.; eds., Climate: History, periodicity, and predictability: International Symposium held at Barnard College, Columbia University, New York, New York, 21-23 May 1984 (R. W. Fairbridge Festschrift): New York, NY, Van Nostrand Reinhold Publishing Corp., 588 p.
Currie, R. W.; Wyatt, Tim; and O’Brien, D.P, 1993. Deterministic signals in European fish catches, wine harvests, sea level, and further experiments: International Journal of Climatology. 8:255-281.
Currie, R. G., 1984, Evidence for 18.6-year (sic) lunar nodal (sic) drought in western North America during the past millennium: Journal of Geophysical Research. 89:1295-1308.
DICKSON R R, T. J. OSBORN, J. W. HURRELL, J. MEINCKE, J. BLINDHEIM, B. ADLANDSVIK, T. VINJE, G. ALEKSEEV, AND W. MASLOWSKI (2000), The Arctic Ocean Response to the North Atlantic Oscillation. Journal of Climate. Vol. 13. 2671-2696.
Egbert, G.D., Ray, R.D., 2000. Significant dissipation of tidal energy in the deep ocean from ocean inferred from satellite alitimeter data. Nature 405 (6788), 775–778.
Keeling, Charles D. and T. P. Whorf. 1997. Possible forcing global temperature by oceanic tides. Proceedings, National Academy of Sciences of the United States. 94:8321-8328.
Lindquist, A. 2002. Herring periods of Bohuslan: a cross-sectorial approach. ICES Marine Science Symposia, 215: 343-351.
Ljungman, A. V. 1879. Bidrag till løsningen af frågan om de stora sillfiskenas sekulära periodisitet. Tidskrift for Fiskeri, 5: 257-268. (In Swedish).
Maksimov, I. V. and Smirnov, N. P. 1964. Long-range forecasting of secular changes of the general ice formation of the Barents Sea by the harmonic component method. Murmansk Polar Sci. Res. Inst., Sea Fisheries, 4: 75-87.
Maksimov, I. V. and Smirnov, N. P. 1965. A contribution to the study of causes of long-period variations in the activity of the Gulf Stream. Oceanology. 5:15-24.
Maksimov, I. V. and Smirnov, N. P. 1967. A long-term circumpolar tide and its significance for the circulation of ocean and atmosphere. Oceanology 7: 173-178 (English edition).
Maksimov, I. V. and Sleptsov-Shevlevich, B. A., 1970. Long-term changes in the tide-generation force of the moon and the iciness of the Arctic Seas. Proceedings of the N. M. Knipovich Polar Scientific-Research and Planning Institute of Marine Fisheries and Oceanography (PINRO). 27: 22-40.
Pettersson, O. 1905. On the probable occurrence in the Atlantic current of variations periodical, and otherwise, and their bearing on metrological and biological phenomena. Rapports et Proce`s- Verbaux des Re ́unions de Conseil Permanent International pour l’Exploration de la Mer, 42: 221e240
Smedsrud, L. H., et al. (2013), The role of the Barents Sea in the Arctic climate system, Rev. Geophys., 51, doi:10.1002/rog. 20017.
Yndestad, H: 1999. Earth nutation influence on the temperature regime of the Barents Sea. ICES Journal of Marine Science; 56; 381-387. 1999.
Yndestad, H. (2006). The influence of the lunar nodal cycle on Arctic climate. ICES Journal of Marine Science, 63(3), 401–420. http://doi.org/10.1016/j.icesjms.2005.07.015
Yndestad H. 2004 The Lunar nodal cycle influence on the Barents Sea. Dr. philos. Thesis. NTNU. Trondheim, Norway.
Yndestad, H., Turrell, W. R., & Ozhigin, V. (2008). Lunar nodal tide effects on variability of sea level, temperature, and salinity in the Faroe-Shetland Channel and the Barents Sea. Deep-Sea Research Part I: Oceanographic Research Papers, 55(10), 1201–1217. http://doi.org/10.1016/j.dsr.2008.06.003.

I am a little confused by the language.
Are you saying that the recurring cycle of length 74 years will (tend to) continue its influence in reducing the annual maximum of Arctic Ice Cover, until the cycle reaches a turning point in 2029 A.D. ; while the cycle of length 223 years has already had a turning point, in 2018 A.D., and will, from now on, (tend to) increase Arctic Ice Cover? Will the ‘influences’ of these two cycles approximately balance each other in the decade of the 2020s? From 2030 A.D. onwards will the two cycles both be (tending to) increase the maximum of Arctic Ice Cover?
Hei
Du finner svaret på min nye post. Solens elliptiske baner fører til at solen roterer rundt et felles massesenter. Når solen roterer roterer solens dynamo og vi får stråling på solens overflate. Virkningen er størst når alle planetene er samlet i banens perihelion. Da har en mints stråling og vi har et såkalt Grand solar minimum
Hilsen
Harald Yndestad
Yes. Stationary periods are expected to continue. The stationary 75-year period and the 223 year period have constructive interference when they have same phase-relations and deconstructive interference when the periods have different phase-relations. The 75-year period is confirmed in North Atlantic Water temperature data series. The 223-year period is only identified in the Ice Edge Position data series.
Harald Yndestad
Det er en mengde varme kilder fra Island og opp igjennom Framstredet. Blant annet en vulkan som har topp 20 meter under havoverflaten. Hva tenker du om dette og iskanten.
Hei
Det er vanskelig å si. Et varig utbrudd vil kunne påvirke middelverdi over tid. Tilfeldige vi være “støy” i måling.
Jeg er ikke kjent med at noen har undersøkt dette.
Harald Yndestad