The Mauna Loa, Hawaii CO2 data series cover the period 1958-2020, which is the longest continuous record of direct atmospheric CO2 measurements. Data are recorded at an altitude of 3400 m in the northern subtropics, which is not the same as the globally averaged CO2 concentration at the surface. The data series is managed by NOAA Global Monitoring Laboratory. https://gml.noaa.gov/ccgg/trends/data.html

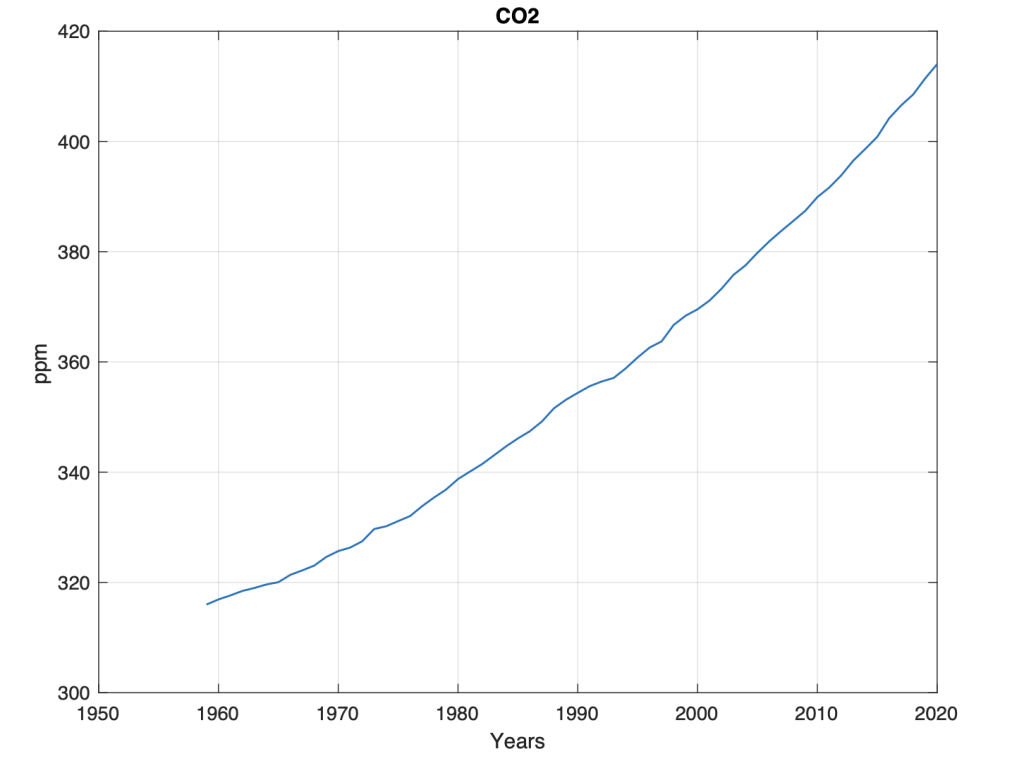
Figure 1. Mauna Loa, C02-m background level for the period t = 1959-2020
Figure 1 shows the growth of the background level of CO2 for the period 1959 to 2020, measured at Mauna Lua, Hawaii. Figure 1 shows that the background level for CO2-m apparently has an exponential growth. An exponential CO2 growth can be explained by the fact that CO2 emissions accumulate over time in the atmosphere. Another explanation is that the background level for CO2 has no natural state. It has natural changes as part of migration processes between ecosystems, the atmosphere and ocean areas. A third explanation is that CO2 background is accumulated CO2 from oceans, controlled by global temperature variations.

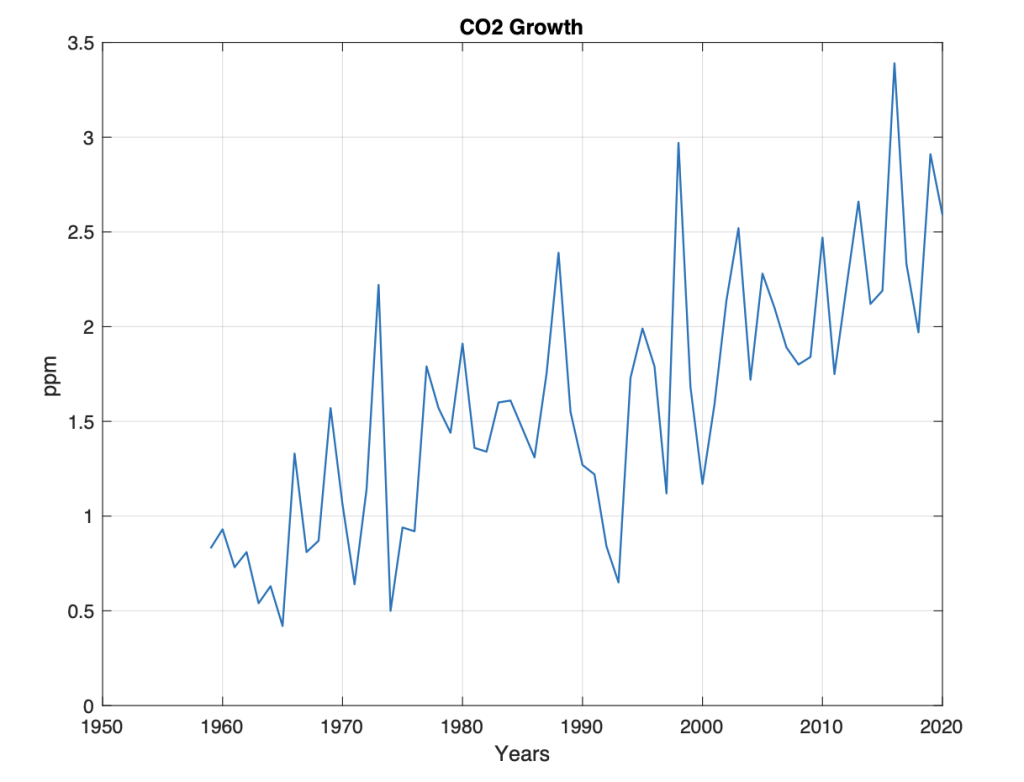
Figure 2. Annual background growth dCO2-m for the years t = 1959 … 2020.
Figure 2 shows annual growth: dCO2(t) = CO2(t)-CO2(t-1)), for the period t = 1959 … 2020. It appears from the figure that growth began to increase from about 1965 and that it reached a maximum in about 2010. We see here that growth is least in the cold period in the 1960s and stabilized to a maximum from about 2010. This indicates a connection between global temperature growth in the background level for CO2. At the same time, we see that growth has large fluctuations. We find the properties of the fluctuations by studying the signature, or the spectrum of annual CO2-m growth.
CO2-m period signature

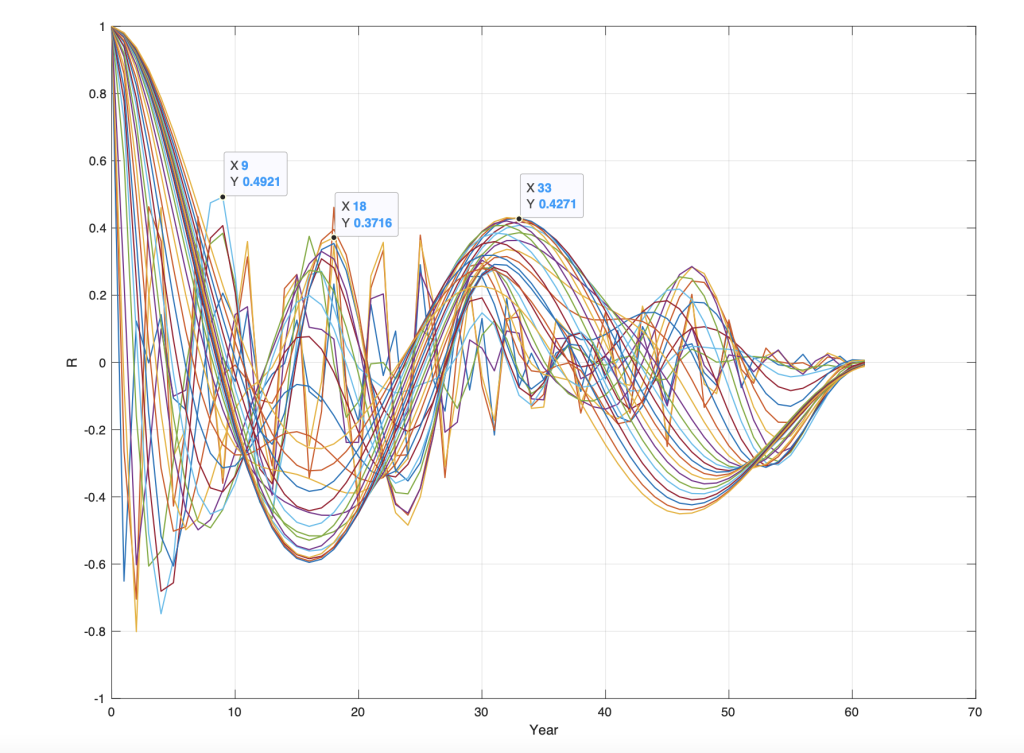
Figure 4. Autocorrelation of the wavelet spectrum Waco2 (R (s), m) for annual background growth in dCO2-m for s = 1 … 60 and m = 1..60.
Autocorrelation of a wavelet spectrum calculates the correlation of stationary periodic changes in the wavelet spectrum. Stationary dCO2-m periods, Sdco2(Adco2(t), Tdco2(), Fdco2(t)), in the wavelet spectrum Wdco2(s, t) (Figure 2) are estimated by calculating the autocorrelation of all wavelets in the wavelength spectrum Wdco2 (s , t). The calculated autocorrelations, WRdco2(R (s), m), for the wavelet spectrum, Wdco2 s, t), have maximum correlations (R) in the following periods: WRgst(R(max), Tgst()) = [(0.5, 3), (0.5, 9), (0.4, 18), (0.42, 33)] (Figure 4). The identified stationary dCO2-m period has the correlation R () = [0.5, 0.5, 0.4, 0.4] to the periods: Tdco2() = [3, 9, 33, 64] (yr.).
CO2-m phase signature

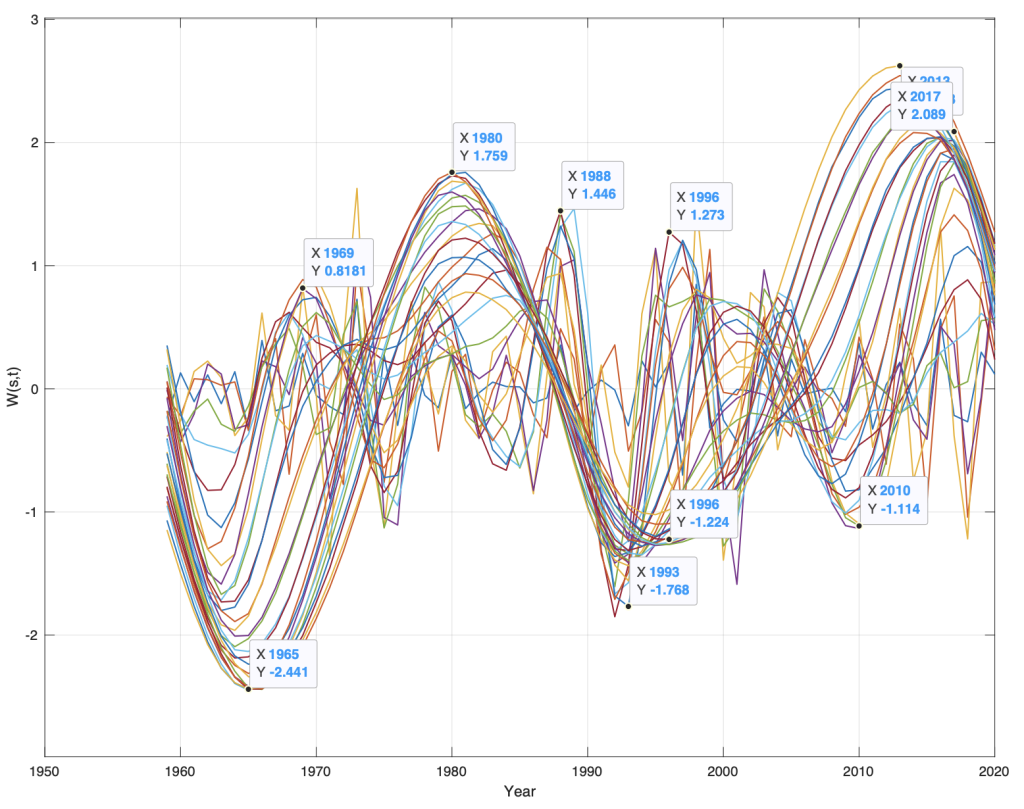
Figure 3. Wavelet spectrum for annual background growth in CO2-m from the years t = 1959 … 2020.
Figure 3 shows the wavelet spectrum Wdco2(s, t) for CO2 growth, dCO3 (t). The long period in the wavelet spectrum in Figure 3 has min / max for: Wdco2(s = min / max, t) = [(-1.64, 1965), (-0.0, 1973), (1.8, 1980), (+0.0 , 1988), (-1.2. 1995), (-0, 2004), (2.5, 2013)] at intervals of [8, 7, 8, 7, 9, 9], at a mean distance of 8 years. The whole period encompasses a period of 4*8 = 32 years. The wavelet spectrum simultaneously has correlations for a period of: Wdco2(s = min / max, t) = [(0.8, 1969), (0.8, 1979), (1.5, 1968), (1.2, 1997), (0.8, 2005)], at an average distance of [10, 9, 8, 8] years, and an average period of 8.75 years. This shows that the growth in the global background level for CO2 is not composed of random changes. The growth in CO2 from 1959 to 2020, is a stationary periodic change of about 9 and 64 years.
Lunar forced CO2 signature
Lunar nodal driven temperature periods in the ocean, have stationary periods of Tln () = [1/3, 1, 4, 7]18.61/2 = [3.1, 9.3, 37.2, 65.1] years. The error deviation [Tln() – Tdco2()] = [0, 0, 4, 1] years, which has a mean deviation of only 1.25 years. The CO2-m growth has a minimum at the year 1965, when GST has a minimum.
Global sea temperature (GST) has a phase state (+0, 1960) when dCO2 has the phase state (-1.65, 1965), or a phase lag of pi/2 (rad). The growth of CO2-m has a minimum when GST has a maximum speed of cooling. GST has a phase state (-0, 1993) when dCO2-m has the phase state (1.92, 1995). The growth of CO2-m has a maximum when GST has a maximum speed of warming.
Discussion
The CO2 growth has a coincidence to GST variations. CO2 and GST have the lunar nodal tide signature. This suggests that the source of changes in the background level of CO2 is temperature changes in the ocean surface, driven by a lunar nodal temperature spectrum. This CO2 data series covers a time of 60 years. Longer CO2 data series are expected to have longer periods in the lunar forced signature. The source of the lunar nodal spectrum is the lunar nodal tide. The lunar nodal tide, which is affected by the moon. The scope of this analysis is that CO2 growth is controlled by sea temperature variability, which is controlled by the moon.
Referanse
- Yndestad Harald, 2022b: Lunar Forced Mauna Loa and Atlantic CO2 Variability. Science of Climate Change, Vol. 2.3 (2022) pp. 258-274. https://doi.org/10.53234/scc202212/13
