The biomass of Norwegian Arctic cod is reduced during the past 10 years. The spawning stock has been reduced the last 14 years. Total quota of cod was adjusted down by 20 per cent in the years 2022, 2023 and 2024. The situation is alarming. Marine scientists are not sure why the stock cod recruits less since 2009. The fishing industry is not sure what to expect in the future.
Reduced growth in recruitment of cod is a warning.Tthe Barents Sea is cooling.
The stock of cod from 1946

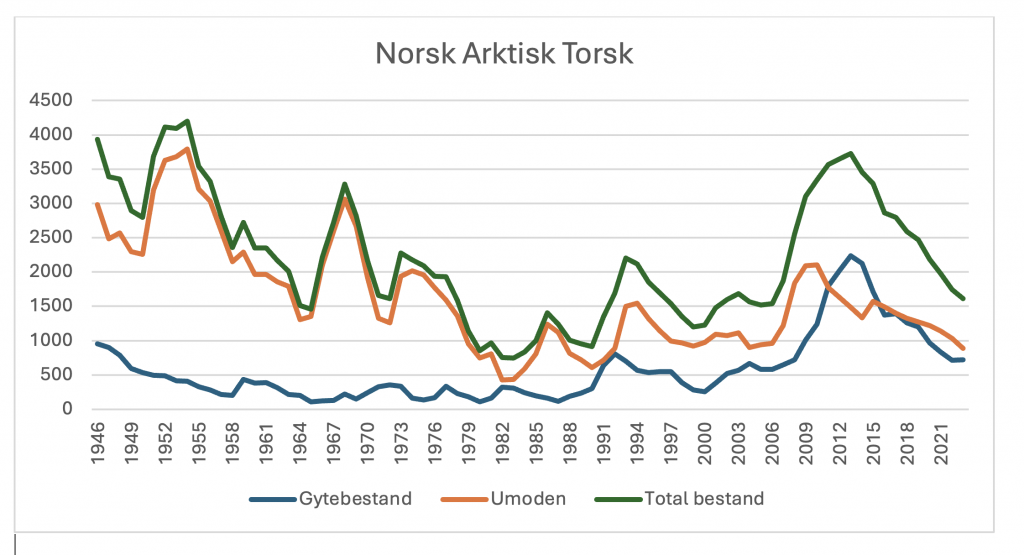
Figure 1. The stock of Norwegian Arctic cod (1000 tones) with spawning stock (blue), immature recruitment (yellow) and total stock (black) for the years 1946 to 2023.
Figure 1 shows the stock of Norwegian Arctic cod for the years 1946 to 2023. The population was gradually reduced from a maximum in the year 1946 to a minimum in the year 1982. From 1982 there was a new period of growth until the year 2013. The stock of cod had temporary maximum in the years 1953, 1968, 1974, 1986, 1993, 2013. The spawning stock had its maximum in the years 1993 and 17 years later in 2010. After 2010, the spawning stock had a downward trend. If there is a maximum growth after another 17 years, we can expect an upcoming next maximum at the year 2027.
Spawning lifecycles
Norwegian Arctic cod are spawning after approx. 6 years. This period is adapted an 18-year temperature cycle to gain optimum recruitment in lifecycles. When the stock is spawning after 6 years, it can produce two good year classes within an 18-year climate cycle. A good 2010-year class would normally recruit a new good year class in 2016. A good year class that never came. This may indicate that the good 2010-year class was not taken good care of. A year class which was supposed to give new growth from 2016. This may explain why the spawning stock has a long downward trend from 2009. The next expected temperature maximum is the year 2024. From 2024 we may expect a new good year class approx. at the year 2027.
Warm and cold climate periods
It has been known for more than 100 years that there is a direct connection between sea temperature and recruitment of Norwegian Arctic cod. The big question is what causes temperature changes in the ocean.
The wind theory has its roots back to the German mathematician Karl Zöppritz (1838-1885). He created a model in the 19th century, which showed that the wind can cause vertical stirring of warm and cold temperature profiles in the ocean. This became the prevailing opinion, right up to our time.
In 1980´sThen came the climate models. Models that calculated that greenhouse gases can lead to global warming of the atmosphere and sea surface temperature. Man-made global warming has been a prevailing opinion the last 20 years.
Studies of long time series has revealed astronomic signature temperature variations. The temperature of the of warm Atlantic water inflow to the Norwegian Sea and the Barents Sea has been recorded by marine research in Aberdeen and Murmansk since 1900. The timeseries now represent the world’s longest oceanographic temperature timeseries. They reveal that the sea temperature in the Norwegian Sea and the Barents Sea has periodic changes of approx. 18 and 74 years. These are periodic changes that can be traced back to tides, ocean currents, changes in the Earth’s rotation and the moon’s elliptical orbit. It confirms that the sea temperature is controlled by nature’s own rhythm.

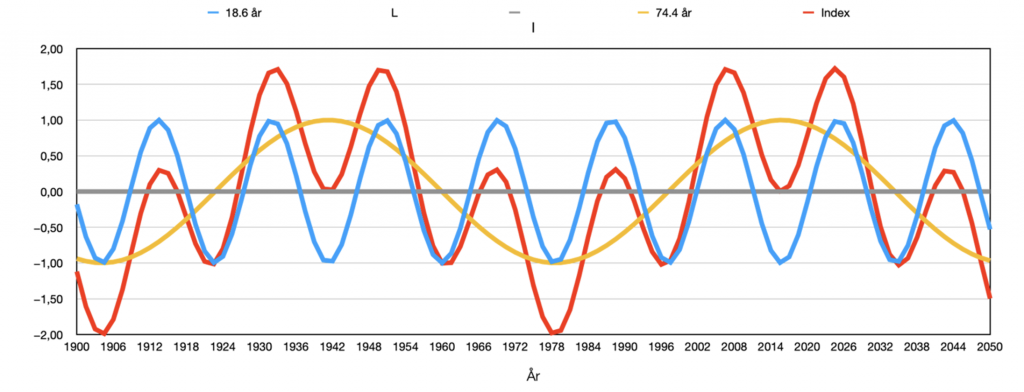
Figure 2. Identified temperature cycles of 18.6 years (blue) and 4*18.6 = 74.44 years (yellow) in the Barents Sea. Index (red) is the sum of the temperature cycles.
Figure 2 shows identified temperature cycles of 18.6 years (blue) and 4*18.6 = 74.44 years (yellow) in the Barents Sea for the years 1900 to 2050. The period of 74.44 years causes a warmed sea and a warm climate in the years (1922-1960), a cold period (1960-1996), warm period (1996-2036), and an expected new cold climate period (2036-2074). The sum of the periods (red) causes a deep temperature minimum in the years 1903, 1978 and 2052.

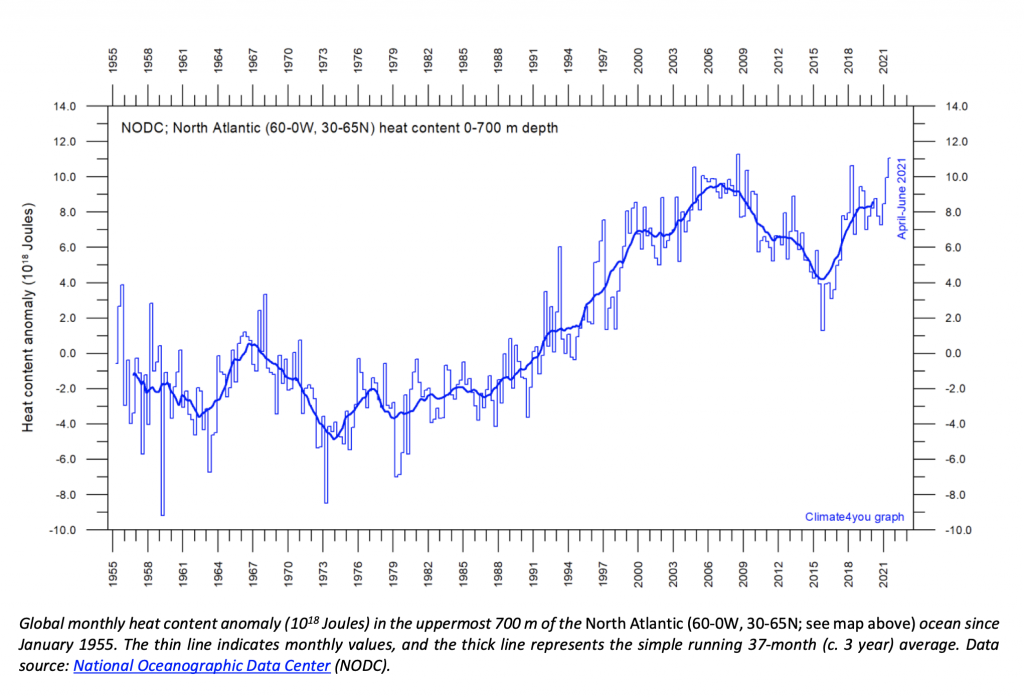
Figure 3 Surface heat in the North Atlantic Ocean for the period 1955-2023 (Source: Climate4you. December 2024)
Figure 3 shows surface heat for the North Atlantic Ocean in the period 1955-2023. The figure reveals a temporary maximum in 1966, a minimum in 1975, a maximum in 2007, a minimum in 2016 and a maximum in the year 2023. The temperature model (Figure 2) has a temporary maximum in 1968, a minimum in 1979, a maximum in 2007 and a minimum in 2016. The average difference between monitored surface heat and the temperature model, is only 2 years.
Temperature cycles and recruitment
It appears from Figure 1 and Figure 2 that there is a direct connection between the temperature cycles and recruitment of Norwegian Arctic cod. Recruitment was greatly reduced in the cooling period from 1950 to 1979. There was a new recruitment growth when there was a new warming period from 1978 to 2006. A new cooling period is expected in the years 2025 to 2052. The stock of cod had the best recruitment (immature 3-year class) around the years [1953, 1968, 1986, 1993, 2010]. The temperature cycles had a maximum in the years [1950, 1968, 1988, 2006]. Th mean difference between maximum recruitment and the stationary temperature cycles is only 2.25 years.
There is a direct connection between cod recruitment and temperature cycles, with an astronomical reference. This means that the idea of a man-made global warming has been rushed. A cooling Barents Sea reveals a longer period of reduced recruitment.
At the same time, the discovery of predictable periodic changes will form a basis for a more predictable management of ecosystems and more predictable investments in the fishing industry.
Cycles of the Sea
References
- Yndestad H. (1999). Earth nutation influence on system dynamics of Northeast Arctic cod. ICES Journal.
- Yndestad H. (2001). Earth nutation influence on Northeast Arctic cod management. ICES Journal.
- Yndestad H. (2003). The code of the long-term biomass cycles in the Barents Sea.
- Yndestad H. (2004). The cause of Barents Sea biomass dynamics. Journal of Marine Systems.
- Harald Yndestad, William R Turrell, Vladimir Ozhigin. 2004. Temporal linkages between the Faroe-Shetland time series and the Kola section time series. ICES CM 2004/M. Maastricht. Theme Session M. Regime Shifts in the North Atlantic Ocean: Coherent or Chaotic?
- Yndestad H. (2006). The influence of the lunar nodal cycle on Arctic climate. ICES Journal.
- Yndestad Harald; William R. Turrell; Ozhigin Vlatimir. (2008). Lunar nodal tide effects on variability of sea level, temperature, and salinity in the Faroe-Shetland Channel and the Barents Sea. Deep-Sea Research I.
- Yndestad H 2018. Climate Clock. The Barents Sea temperature.
- Yndestad H. 2022. Jovian Planets and Lunar Nodal Cycles in the Earth’s Climate Variability Frontiers in Astronomy and Space Sciences. May 10. 2022. https://doi.org/10.3389/fspas.2022.839794.
- Yndestad H 2023. Video foredrag.
Bestandsutvikling og periodisering. Skippermøtet 2023.
